Visualize Data Relationships
Advertisement
ChartFire for Mac v.1.0.0.36
ChartFire for Mac is an indispensable plug-in that lets you go beyond the data representation capabilities of FileMaker.
Advertisement
ParaView 3.98.0-RC3 v.3
ParaView is an open-source, multi-platform data analysis and visualization application.
SharePoint Business Charts v.1.0.806.3
SharePoint Business Charts can quickly and Easily Create Charts,Multiple Chart Types Supported,Supports Aggregate Functions to Analyze Data,Supports Multiple Data Sources,Supports Grouping and Filtering,Customizable Appearance.
ApexSQL Search v.2013.04
ApexSQL Search is a Free SQL search add-in for SSMS and Visual Studio. It offers text search in SQL database objects and data, allows safe renaming of SQL objects, and graphical visualization of object interdependencies. Supports SQL Server 2012.
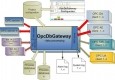
OpcDbGateway v.4.00.00
Configuring and running of data exchange between various sources - OPC servers, OPC client applications, device communication drivers, data handling, monitoring, storage into process databases, trends, alarms, logging, reports, integrating to SOA.
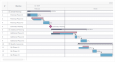
AnyGantt v.4 1
AnyGantt is an advanced Flash based data-visualization solution, allowing everyone to utilize power of animation and ultimate interactivity. AnyGantt is an ideal tool for building complex and informative Gantt charts.
ChartFire for FileMaker v.1.0.0.36
Provides customizable charts generation facilities. ChartFire is an indispensable plug-in that lets you go beyond the data representation abilities of FileMaker. ChartFire provides customizable charts generation facilities.
KNIME v.2.2.0.0026436
Data exploration platform to help you with your work. KNIME, pronounced [naim], is a modular data exploration platform that enables the user to visually create data flows (often referred to as pipelines),
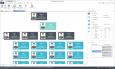
OrgCharting v.1.3
OrgCharting helps users create professional and data-interactive organizational charts. It is useful in strategic planning and workforce management.

OrgCharting for Mac v.1.3
OrgCharting helps users create professional and data-interactive organizational charts. It is useful in strategic planning and workforce management.
AnyGantt JS Gantt Charts v.8.7.0
AnyGantt is a flexible, cross-platform and cross-browser JavaScript charting library that allows you to easily build smart HTML5 Gantt Charts and utilize the power of animation and ultimate interactivity to facilitate project and resource management.